Saturday, November 05, 2005

Automated Methods of Semantic Reconciliation of Structured Enterprise Data Sources

One of the biggest difficulties in building enterprise-wide data warehouses is assembling logical models of entities sourced from the data within ERP/SCM/CRM/BPM schemas, where the same entity (e.g. customer, product, employee) exists in multiple locations. In any given corporation, there are extraordinarily few, if any, individuals who know the details of more than one of the underlying schemas. For example, I may know where the customer data in a Siebel CRM system is held, but I would not have any idea where this is held in Oracle Financials or SAP R/3. To enable BI application construction where data is sourced from multiple transactional systems, vendors will have to lower the barrier to building an enterprise-wide information model, otherwise I don’t believe it will be adopted. The paper below discusses the challenges in accomplishing this, which are substantial, but there is tremendous room for innovation here that is necessary to make enterprise-wide performance management feasible.

An excellent article from ACM Queue discusses some recent research in this area that shows some promise for making this crucial task much easier:

Making heterogeneous schemas play nicely together has challenged computer
scientists for years, but we're on the path to better behavior.
Reconciling the vocabularies of different data sources is also the subject of the thesis by Dr. AnHai Doan which won the 2003 ACM's Prestigious Doctoral Dissertation Award. It's a fascinating read.

Sunday, October 30, 2005

Semantic Unification of Business Information Systems

Business Information Systems continue to grow increasingly powerful as we become better at being able to represent the various types of information in the enterprise. The walls between performance management, content management, knowledge management, and business process management, will continue to crumble in the next couple of years as enterprises realize the strategic value of developing information models that leverage all of these technologies to form rich information tapestries within which the fabric of good decisions can be woven. Whether one considers a relational or multidimensional database, all the documents in a content management system, all of the data being passed through web services, or the trillions of web pages available, it seems obvious that there is value in developing semantic models that can unify the understanding of this data across these various domains.

While there is a lot of research and implementation of techniques of semantic integration of metadata stored in relational databases used by performance management vendors (e.g. CWM, or the Common Warehouse Metamodel), there is definitely a renewed interest in standards-based metadata representations of web content, leading to the "semantic web". Naveen Balani presents a very thorough overview of the semantic web that is well worth reading in his article on IBM's Developer Works entitled, "The future of the Web is Semantic".

The Semantic Web provides a common framework that allows data to be shared and reused across application, enterprise, and community boundaries. You can think of the Semantic Web as an efficient way to represent data on the World Wide Web, or as a database that is globally linked, in a manner understandable by machines, to the content of documents on the Web. Semantic technologies represent meaning using ontologies and provide reasoning through the relationships, rules, logic, and conditions represented in those ontologies.

Monday, October 24, 2005

The difference between a "Scorecard" and a "Dashboard"

With the release of Hyperion System 9, we've provided a single workspace environment for any user to engage in Performance Management activities, including working with both dashboards and scorecards. Unfortunately, I frequently hear our customers and prospects get confused on the difference between them, so I thought I would take a moment to clarify the difference.

When running any business, it is important to understand the historical and current drivers of success. A dashboard provides a window into the historical and current drivers of success by providing a navigable, interactive environment in which KPIs can be explored to uncover the detailed root causes of the existing business situation. Furthermore, dashboards provide a link to other operational information for further insight.


A Dashboard in Hyperion System 9

In Hyperion System 9, our dashboards provide:

  • Associations. Allows authorized end-users associate objectives, metrics, targets, and initiatives with each other.
  • Multiple Targets. Allows users apply two or more targets and associated thresholds to each metric, including forecasts, budgets, prior actuals, and external benchmarks, among others.
  • Groupings. Allows authorized end-users categorize objectives, metrics, and initiatives by different perspectives.
  • Guided Navigation. Uses steps to guide less experienced users through the data or analysis by limiting the drill down/across paths and providing context-sensitive recommendations for next steps (i.e. reports to see or actions to take).
  • Dynamic Views. Allows users to define and subscribe to new views of “right-time” data coming from one or more operational systems.
  • Advanced Analysis. Allows users perform “what if” analysis to model scenarios and perform regressions to improve the accuracy of forecasts, among other things.

Of course, any well-run business will not be focused on the past, but also care deeply about the future. What should the business goals be? What strategies should we use to achieve those goals? What metrics should we use to help us indicate whether we are on the right track? A scorecard is a framework for aligning corporate goals, the strategy used to achieve those goals, and the measurement of those goals. In other words, it is a forward-looking vehicle that can be used to drive the performance of the business.

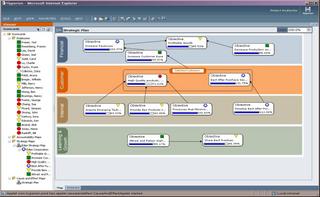
A Scorecard in Hyperion System 9

In Hyperion System 9, our scorecards provide:

  • Support for Kaplan and Norton's Balanced Scorecard Methodology, Stern Stewart's Integrated EVA Scorecard, and the Malcolm Baldridge frameworks
  • Strategy, Cause-and-Effect, and Accountability Mapping
  • Alerting when KPIs exceed established thresholds
  • Initiative Tracking
  • Performance Reporting

A scorecard or dashboard implementation can be very valuable to a business, but as you can surmise from the above, they are particularly powerful when used together. Having a window into the past, present, and future performance of your business is a clear strategic advantage, which is why Performance Management technologies are at the top of every executives mind these days.

Monday, October 17, 2005

Simple Semi-Structured Data

This is an excellent article by David Loshin on the value of what he terms "semi-structured data". I've seen this term being used to describe a wide variety of data, including raw HTML, XML, etc., but I think that Loshin captures a more precise and hence useful definition.

"There is an intermediate classification of content called “semi-structured data.” This refers to sets of data in which there is some implicit structure that is generally followed, but not enough of a regular structure to “qualify” for the kinds of management and automation usually applied to structured data. We are bombarded by semi-structured data on a daily basis, both in technical and non-technical environments. For example, web pages follow certain typical forms, and content embedded within HTML often have some degree of metadata within the tags. This automatically implies certain details about the data being presented. A non-technical example would be traffic signs posted along highways. While different areas use their own local protocols, you will probably figure out which exit is yours after reviewing a few highway signs."

"This is what makes semi-structured data interesting—while there is no strict formatting rule, there is enough regularity that some interesting information can be extracted. Often, the interesting knowledge involves entity identification and entity relationships. " This doesn't sound a lot different than classic ERD modeling or relational data warehouse modeling. With existing pattern recognition techniques, I wonder how difficult it would build a generic parser across semi-structured and structured data that could come up with composite entity models across multiple information domains?

Sunday, October 16, 2005

How to handle deleted records from a source system in a data warehouse?

Question from comp.databases.olap USENET group:

I would like to see if someone can share their experience in handling deleted records from legacy source system in data warehouse. I don't see much coverage on this topic in Kimball literatures on how to handle this in ETL and model design. Did I miss something?

My response:

Hi Doug,

This is an excellent question. In my experience, the event of deleting records can be a very valuable source of information about a business process, and thus, it is very useful to capture the event in the data warehouse. I have typically handled this by adding a DELETED column to the fact or dimension table that stores a value of Y or N (or 0 or 1) for deleted versus valid records.

Then, from the end-user tool, during query execution, you can modify your query criteria to check for records that are marked deleted versus valid. To ensure adequate performance, make sure that the DELETED column is indexed using the appropriate technique for your database. In Oracle DBs, low cardinality columns like this are usually retrieved most efficiently by using bitmap indexes.

Note that for auditing purposes, this method works very well, because the underlying integrity of the systems are not challenged by using flags to mark deleted records. It is entirely possible to see the deleted records with the appropriate query.

Good Luck,

Nenshad