This bring up the more important point of the value of the quality of visualization in general and it is particularly pertinent to my current employer. SAP has long been associated with many positives in software industry in terms of comprehensiveness of functionality, industry-specific business process logic, etc., but the visuals of our UI were never really a focus of our efforts until very recently. This has given our software the reputation of being very difficult to use, and it's well-earned. It is an incredible shame from a business standpoint that SAP offers some of the most comprehensive application functionality on the planet, yet many customers have refused to use the functionality because they don't find it user-friendly.
I'm happy to say that we are starting to really "get it" however and have made and will continue to make a lot of improvements in our software via the paradigm of what we call "user-centered design". You can read about it at the SAP Design Guild, which is a great resource for UI designers. Of specific note to BI however, is that we realized that customers had so much valuable SAP data in their existing environments that they would love to be able to distribute to a MUCH wider-variety of folks. I'm not talking about the users who know the difference between a "dimension" and a "measure" or who want "multidimensional slice and dice with unbalanced hierarchies." We and a number of our partners already have great tools for this type of user.
But what nobody else in our industry aside from SAP is offering are analytical applications geared towards the common business user, the folks who really don't know and don't care to know about "dimensions" and "measures". But what they do understand are intuitive visualizations like charts and gauges, and they definitely understand their business processes. If they could be provided with applications that fused analytical content with the operations they perform in their transactional systems in a highly intuitive way, wouldn't they be far more productive? We think so, and this is the promise of our analytical applications, SAP Analytics.
Check out the application below, which we lovingly refer to as the "Blocked Order List":
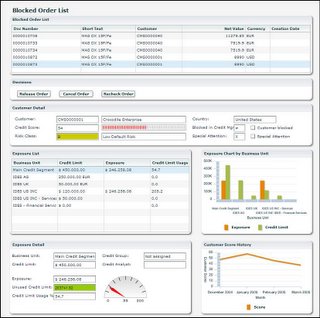
This is an analytical application for a credit manager. As part of her job, she has to decide whether customers whose credit is exceeeded should be allowed to have their orders go through. See any "dimensions" or "measures"? See a separate "report tab" and an "action-link" back to the transactional system to actually conduct the transaction? No! It's all here, right on this screen. All the analytical and transactional data that the credit manager needs to make a good business decision appears in a very user-friendly manner along with three buttons that actually allow her to make the decision right there on the spot. How much training do you think it would take any credit manager to use this application? How about five minutes? And yet, how much better would her decisions be if she actually made them with this information right at her fingertips? This is the power of our analytical applications, and we are only getting started.
If you are tired of developing or having your staff develop reports that sit in people's inboxes or on their portal screens or even worse, are never used at all, then you owe it to yourself to check out SAP Analytics!


