Wednesday, April 05, 2006

Contrasting Oracle's BI "Strategy" with SAP's BI Strategy

I was very pleased to see some great coverage today on SAP's Analytics and BI Strategy in the following article by Stephen Swoyer in Enterprise Systems: SAP Speaks Softly, but Carries a BIg Stick.


"For example, last month Oracle announced its first-ever Oracle Business Intelligence Suite product, which incorporates analytics capabilities Oracle acquired from the former Siebel Systems Inc. In promoting its new business intelligence (BI) suite offering, Oracle took the fight right to the BI pure-plays, arguing—in effect—that its ERP, database, and applications experience functioned to give it an especial insight into BI. "

"SAP could credibly make the same claim—perhaps even more so than Oracle. But the German ERP giant’s strategy has instead been content to quietly flesh out its own Netweaver-based BI stack, even as it downplays its own ambitions in the broader business intelligence marketplace."


I think Stephen was being very polite. Oracle's BI "strategy" is to make a big public proclamation to disguise the fact that they are throwing a huge bunch of products with disparate architectures, development teams, roadmaps, etc. into one big frying pan and hoping that their customers will get an Analytics omelette, when they are more likely to get salmonella.

How exactly does one "Fuse" the following products for each of the applications stacks that Oracle now possesses?

If you own Oracle applications, your BI and Analytics stack might include:
  • Front-End: Oracle Daily Business Intelligence and Oracle Discoverer
  • ETL: Oracle Warehouse Builder
  • Data Warehouse: Oracle 10g
If you were a PeopleSoft customer, your BI and Analytics stack might include:
  • Front-End: Crystal and/or SQR for Formatted Reporting
  • ETL: First Informatica PowerMart, then Ascential DataStage
  • Data Warehouse: PeopleSoft EPM

If you were a Siebel Business Analytics customer, your BI and Analytics stack might include:

  • Front-End: Siebel Business Analytics for OLAP and Actuate for Formatted Reporting
  • ETL: Informatica PowerCenter
  • Data Warehouse: Siebel Relationship Management Warehouse

What a mess! I don't even know what the J.D. Edwards folks had, but it probably was different from the other three. So is Oracle going to consolidate all of these and somehow derive value for their customers in the process? And they are offering lifetime support for all of the existing products? It seems more likely that Oracle is going to do what Oracle has always done best historically, which is to extract value from its customers at their expense. Do you think Siebel Business Analytics customers are going to continue using Informatica for the long haul? Do you think PeopleSoft customers will continue to use Ascential for the long haul? Do you think Actuate figures into Oracle's long term plans? It took Oracle all of a few weeks to rip out IBM's hosting of Siebel's OnDemand offering and replace it with their own, so I'm sure they'll be happy to concede revenues for their slow growth database business to their acquired companies' erstwhile partners.

Let's contrast this with SAP's NetWeaver BI stack and SAP Analytics. If you are an SAP customer, here is what you get with SAP NetWeaver BI (and we don't charge you extra for it either):

  • Front-End: BEx Suite - Integrated front-end tools for both Excel and web-based business intelligence. SAP Analytics - highly useable and flexible Analytical Applications targeted to specific roles in specific business processes.
  • ETL: SAP NetWeaver BI provides a highly functional ETL stack, with change data capture, trickle-feed capabilities, and advanced data lineage capabilities. Think it's only for SAP data sources? We have reference customers who use it strictly for non-SAP data.
  • Data Warehouse: SAP NetWeaver BI includes a full-featured ROLAP engine and a plethora of preconfigured relational cubes that customers can leverage out of the box to speed up deployment.

We at SAP like to do right by our customers and use this as our means of acquiring more of them. If you look under the covers, you will find us to offer a complete BI and Analytics stack capable of competing with anyone in the market. And it was built in house. And it runs on one stack, NetWeaver. Just don't expect us to host a four hour webcast to prove it. You can just ask the customers who chose us as their trusted partner, not whom we bought from someone else.

Monday, March 13, 2006

SAP Business Community for SAP xApp Analytics

Thanks to all of you who have written so enthusiastically and asked for further information about SAP xApp Analytics. SAP Business Community is offering a dedicated area specifically for SAP Analytics. You'll benefit from the following:

Webcasts & Online Demos
View Webcast replays, download slides, and read transcripts from presentations about SAP Analytics. Plus, view a demo and see how your employees can use SAP Analytics to make smart decisions, take fast action, and achieve strategic goals.

Discussion Forum
Participate in interesting and informative discussions, ask questions, and share advice about SAP Analytics.

Blogs
Hear from SAP Executive Board members, who offer insight into why analytics are crucial to addressing today's challenges and to capitalizing on tomorrow's opportunities.

Brochures & White Papers
Read brochures and white papers that offer more detail about SAP Analytics, including an IDC white paper "Making Business Processes Dynamic by Embedding Intelligence".

News & Articles
This section features the most recent SAP press releases and news stories that provide meaningful information on SAP Analytics.

More Information on SAP Analytics
Learn more about SAP Analytics and its features & functions, business benefits, and more.

Monday, February 20, 2006

The Value of High Impact Visualization with SAP Analytics

I'm out here this week at TDWI in Las Vegas and had the opportunity to attend Stephen Few's excellent presentation on "Designing Charts to Enlighten". Stephen is an expert in data visualization and really does a great job of helping business presenters to think about how to simplify data visualization by approaching it as an act of explicit design with the intent of delivering the right message to its recipients. For example, I would not have thought of this, but even something as simple as line types (thick versus thin) can convey the importance of the elements they represent. He offers a number of examples of better versus worse design principles on his website which are well worth checking out.

This bring up the more important point of the value of the quality of visualization in general and it is particularly pertinent to my current employer. SAP has long been associated with many positives in software industry in terms of comprehensiveness of functionality, industry-specific business process logic, etc., but the visuals of our UI were never really a focus of our efforts until very recently. This has given our software the reputation of being very difficult to use, and it's well-earned. It is an incredible shame from a business standpoint that SAP offers some of the most comprehensive application functionality on the planet, yet many customers have refused to use the functionality because they don't find it user-friendly.

I'm happy to say that we are starting to really "get it" however and have made and will continue to make a lot of improvements in our software via the paradigm of what we call "user-centered design". You can read about it at the SAP Design Guild, which is a great resource for UI designers. Of specific note to BI however, is that we realized that customers had so much valuable SAP data in their existing environments that they would love to be able to distribute to a MUCH wider-variety of folks. I'm not talking about the users who know the difference between a "dimension" and a "measure" or who want "multidimensional slice and dice with unbalanced hierarchies." We and a number of our partners already have great tools for this type of user.

But what nobody else in our industry aside from SAP is offering are analytical applications geared towards the common business user, the folks who really don't know and don't care to know about "dimensions" and "measures". But what they do understand are intuitive visualizations like charts and gauges, and they definitely understand their business processes. If they could be provided with applications that fused analytical content with the operations they perform in their transactional systems in a highly intuitive way, wouldn't they be far more productive? We think so, and this is the promise of our analytical applications, SAP Analytics.

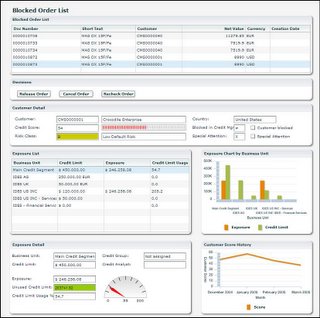
Check out the application below, which we lovingly refer to as the "Blocked Order List":

This is an analytical application for a credit manager. As part of her job, she has to decide whether customers whose credit is exceeeded should be allowed to have their orders go through. See any "dimensions" or "measures"? See a separate "report tab" and an "action-link" back to the transactional system to actually conduct the transaction? No! It's all here, right on this screen. All the analytical and transactional data that the credit manager needs to make a good business decision appears in a very user-friendly manner along with three buttons that actually allow her to make the decision right there on the spot. How much training do you think it would take any credit manager to use this application? How about five minutes? And yet, how much better would her decisions be if she actually made them with this information right at her fingertips? This is the power of our analytical applications, and we are only getting started.

If you are tired of developing or having your staff develop reports that sit in people's inboxes or on their portal screens or even worse, are never used at all, then you owe it to yourself to check out SAP Analytics!

Tuesday, December 06, 2005

Introducing SAP Analytics - Process-Based, Composite Analytical Applications


Dear Readers,

I must apologize for not blogging in a whole month. A lot has changed in that time! I am pleased to share with all of my readers that I have recently joined SAP Labs, LLC as Director, Solution Marketing for SAP Analytics and am very excited to share some of what we are doing with you.

What is SAP Analytics? SAP Analytics is a suite of composite applications built on the SAP NetWeaver platform to enable seamless integration of analysis, transactions, and collaborative steps across the entire value network. For as many years as I was a consultant, I wondered why reporting, OLAP, analysis, etc. were disconnected from the CRM and ERP applications that business users worked on all day. If I were a sales rep working on my pipeline, couldn't I do a much better job if I had access to aggregated, analytical information with important sales KPIs in the same place that I kept my opportunity list? Wouldn't I be more likely to take the appropriate action, like moving my high value deal with a high close probability to the top of my priority list, if I had this rich insight right in front of me?

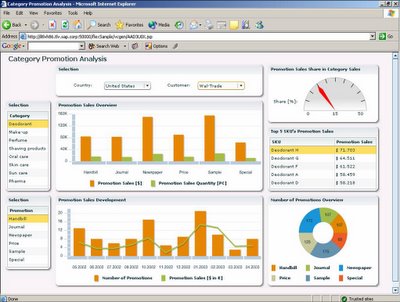
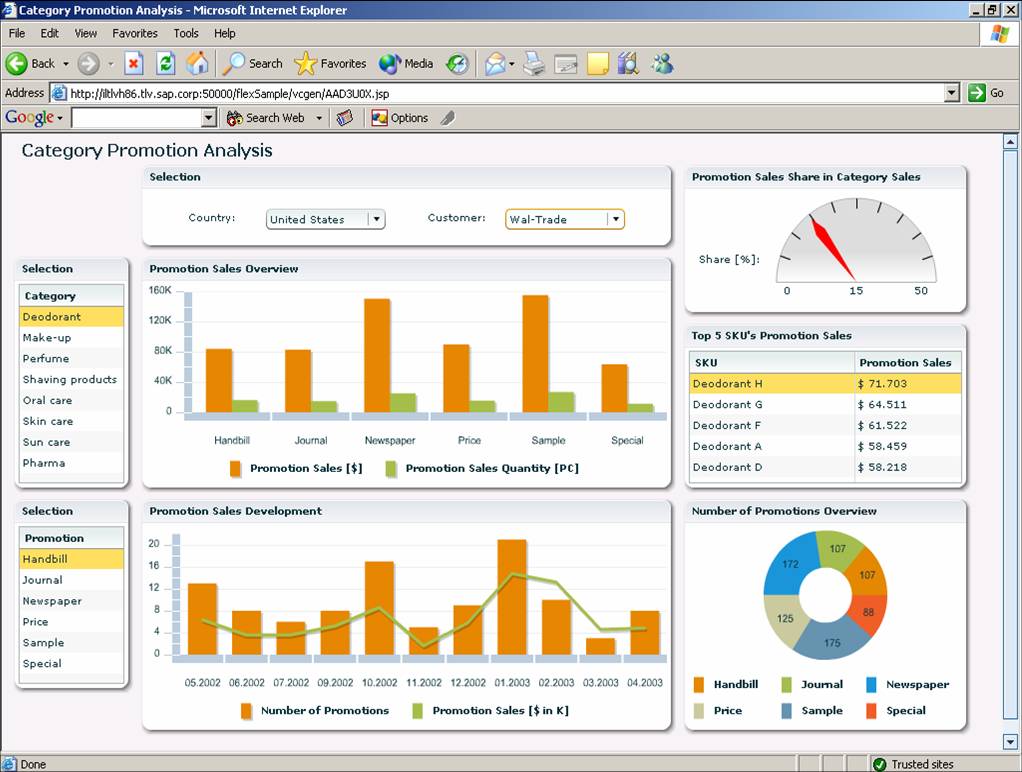
This is the premise of SAP Analytics. While no one questions the value of a stand-alone report or ad hoc analysis conducted using a BI tool, we believe that it can be even more valuable to the business users to gain analytical insight at the exact moment when they need it the most: at the point where they make their decisions. So, in keeping with NetWeaver and Enterprise Services Architecture, we're breaking down the traditional functional application barriers between ERP and CRM and BI and CPM, and giving business users the opportunity to use the most relevant, actionable analytical information we can provide them in the form of composite applications. Take a look at one of the screenshots below of a category promotion analysis application:


The graphical richness and interactivity of SAP Analytics is provided by our partnership with Macromedia (now Adobe), where we are leveraging the rich internet applications technology of their Flex product line. Even cooler, these applications can be constructed very easily by business users using the model-driven approach of our Visual Composer technology.

I will be writing about these technologies and many other things in much more detail in the coming months. I look forward to sharing more with you. In the meanwhile, I encourage you to take a look at the following link on the SAP.com website to learn more:

http://www.sap.com/analytics

Best Regards,

Nenshad Bardoliwalla

Saturday, November 05, 2005

Automated Methods of Semantic Reconciliation of Structured Enterprise Data Sources

One of the biggest difficulties in building enterprise-wide data warehouses is assembling logical models of entities sourced from the data within ERP/SCM/CRM/BPM schemas, where the same entity (e.g. customer, product, employee) exists in multiple locations. In any given corporation, there are extraordinarily few, if any, individuals who know the details of more than one of the underlying schemas. For example, I may know where the customer data in a Siebel CRM system is held, but I would not have any idea where this is held in Oracle Financials or SAP R/3. To enable BI application construction where data is sourced from multiple transactional systems, vendors will have to lower the barrier to building an enterprise-wide information model, otherwise I don’t believe it will be adopted. The paper below discusses the challenges in accomplishing this, which are substantial, but there is tremendous room for innovation here that is necessary to make enterprise-wide performance management feasible.

An excellent article from ACM Queue discusses some recent research in this area that shows some promise for making this crucial task much easier:

Making heterogeneous schemas play nicely together has challenged computer
scientists for years, but we're on the path to better behavior.
Reconciling the vocabularies of different data sources is also the subject of the thesis by Dr. AnHai Doan which won the 2003 ACM's Prestigious Doctoral Dissertation Award. It's a fascinating read.